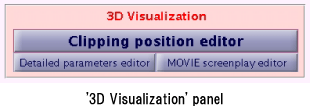
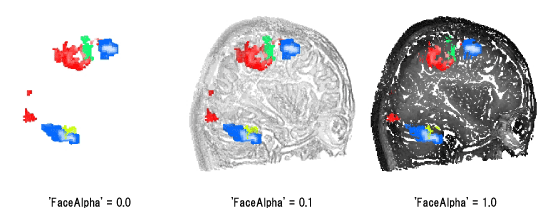
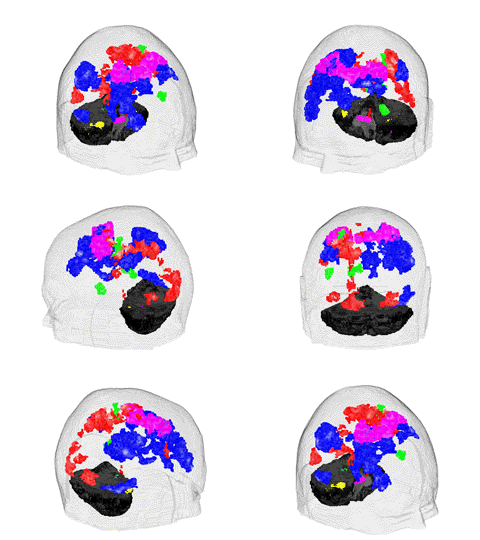
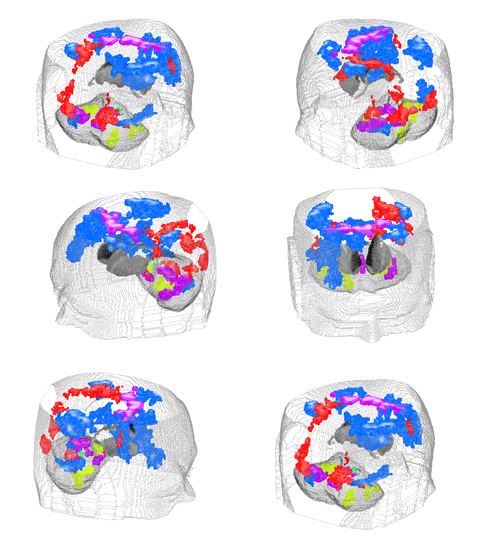
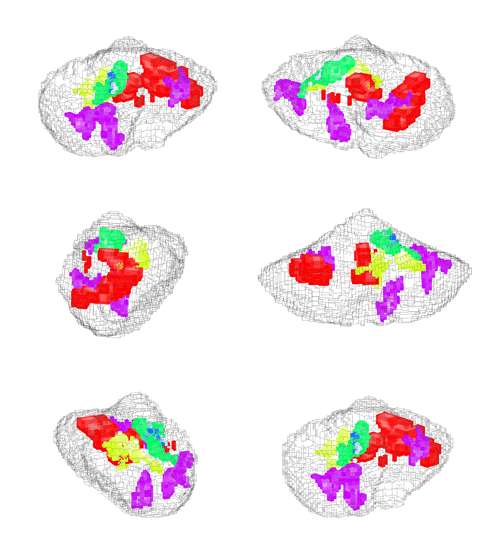
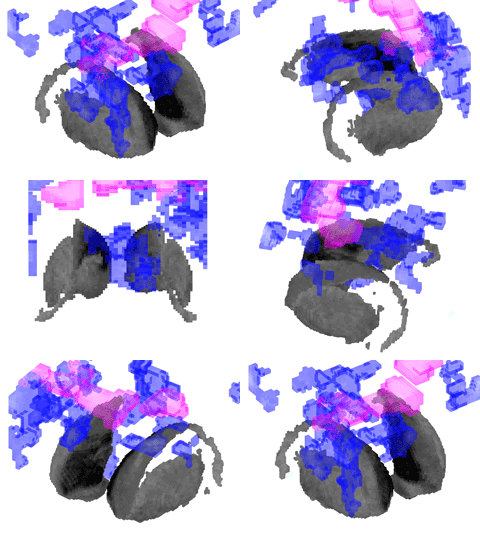
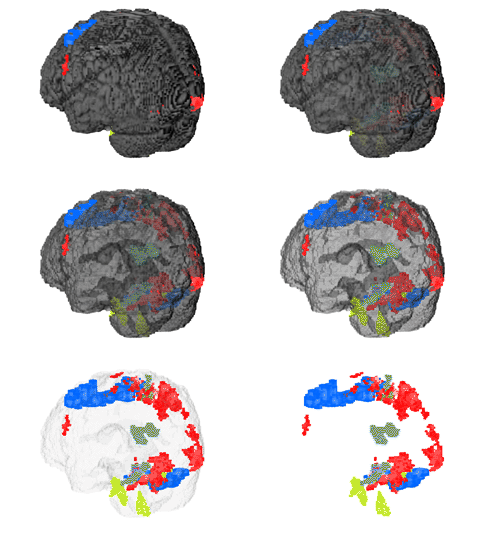
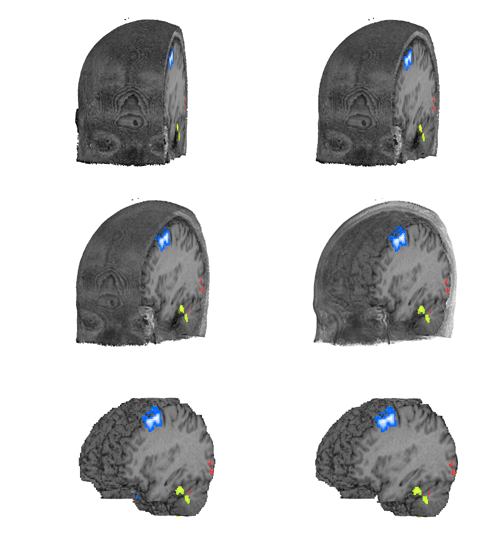
5. '3D Visualization' panel
This program can display Contrast data that overlaps with the
complexity by three dimensions. To display three dimensions, specify
the range of Contrast data on the '3D
Visualization clipping
position' editor window which appears when 'Clipping position
editor' button of '3D Visualization' panel is clicked. If ROI file is
selected with 'Select files' panel,
the brain structure described in the ROI file is displayed by three
dimensions. The ROI file can be easily made with MRIcro in the ANALYZE
form file that sets 0 as outside of, and 1 as in the brain structure.
When 'Edge' or 'Image&edge' is selected with 'Background mode' pop
up menu of 'Detailed
parameters (Draw)' editor window, the edge from the Structure image
will be in the three dimension.
Moreover, animation file (MPEG1 format) where three dimension image
rotates can be made. The animation file is made with the 'MOVIE
screenplay' editor window which appears by clicking on 'MOVIE
screenplay editor' button when three dimension is displaying.
5.1. '3D Visualization
clipping position' editor window
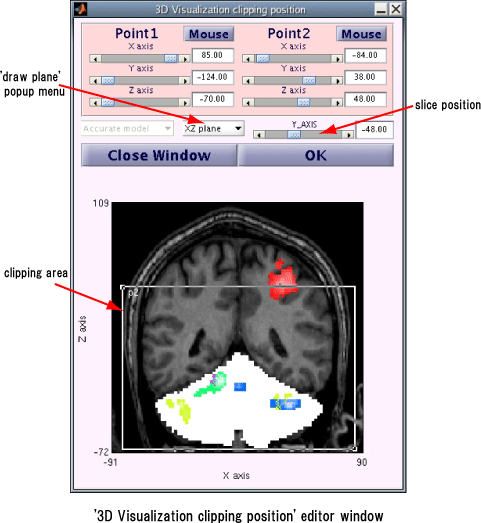
The '3D Visualization clipping position' editor window is used to
specify the range of clipping area to display three dimensions '3D
Visualization clipping position' editor window appears when 'Clipping
position editor' button of '3D
Visualization' panel is clicked.The clipping range of three
dimensions is specified in the rectangular area enclosed in two points
(Point1 and Point2). Please specify Point1 and Point2 by slider and
numerical value box of each coordinate axis.
Moreover, the coordinates are set to the clipping position if it clicks
on the image in the '3D Visualization clipping position' editor window
after clicking on the 'Mouse' button. The plane and the slice
coordinates to display the slice image are set in the '3D Visualization
clipping position' editor window with GUI. The clipping position is
displayed as a rectangle in the slice image if specified slice
coordinates are in the clipping rectangular area.
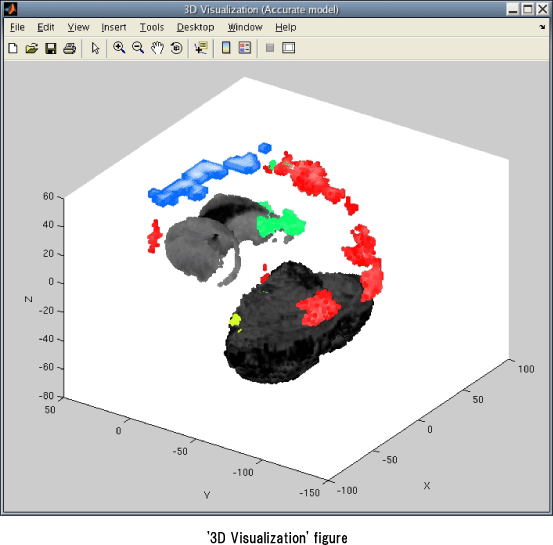
'3D Visualization' figure appears when 'OK' button of '3D Visualization
clipping position' editor window is clicked. The Contrast data in the
clipping area and the brain structure of the ROI file are displayed in
'3D Visualization' figure by three dimensions.
5.2.
'Detailed parameters (3D Visualization)' editor window
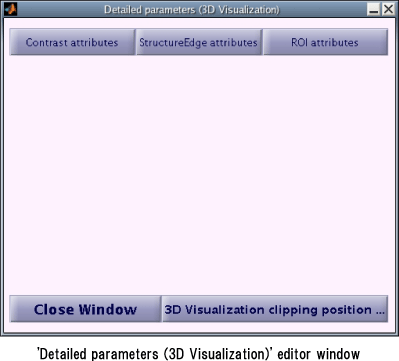
'Detailed parameters(3D Visualization)' editor window appears when
'Detailed parameters editor' button of '3D
Visualization' panel is clicked. The display attribute of three
dimension display data is set with 'Detailed parameters(3D
Visualization)' editor window.
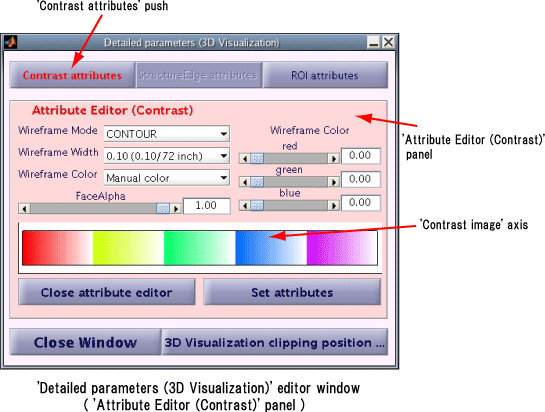
Corresponding Attribute editor appears when 'Contrast attributes'
button, 'structure edge attributes and' button, or 'ROI attributes'
button in the upper row of the Detailed parameters(3D Visualization)
editor window is clicked.
5.2.1. 'Attribute
Editor (Contrast)' panel
When 'Contrast attributes' button of the 'Detailed
parameters (3D Visualization)' editor window is clicked, 'Attribute
Editor(Contrast)' panel is displayed. In 'Attribute Editor(Contrast)'
panel, the display attribute of the Contrast data is set.
In MATLAB with
upper version than the MATLAB R14 Service Pack 2(Version 7.0.4),
'Contrast image' axis is displayed under 'Attribute Editor(Contrast)'
panel. The image of the Contrast data is displayed in 'Contrast image'
axis in the display attribute you are editing.
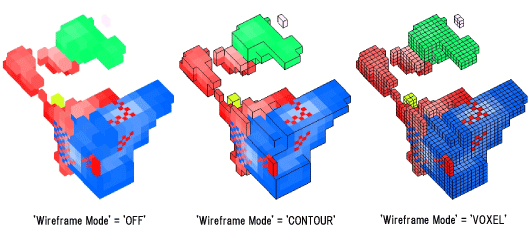
・ 'Wireframe Mode', 'Wireframe Width', 'Wireframe Color'
The wireframe display mode of the Contrast data is specified with
'Wireframe Mode' pop up menu. When it is 'OFF', the Wireframe of the
Contrast data is not displayed. The Contrast data outer displays the
wireframe for 'CONTOUR', and when 'VOXEL' is selected, the wireframe to
all voxel of the Contrast data is displayed. The thickness and the
color of the wireframe are specified with 'Wireframe Width' pop up menu
and 'Wireframe Color' pop up menu. (But these menu are available only
when 'OFF' is selected with 'Wireframe Mode' pop up menu.)When
'Contrast color' is selected with 'Wireframe Color' pop up menu,
wireframe is displayed by the color of the Contrast data. When 'Manual
color' is selected, the wireframe color is specified to display with
GUI at the right of 'Attribute Editor(Contrast)' panel.
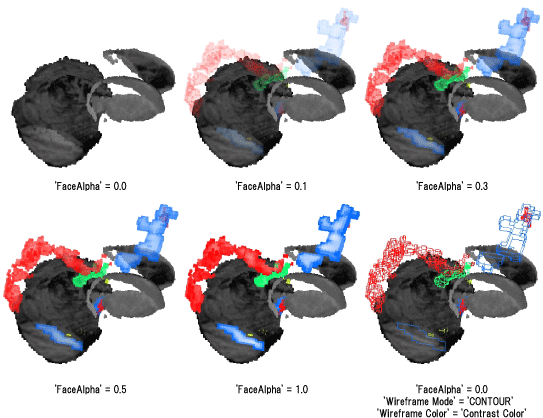
・ 'FaceAlpha'
The transparency of the Contrast data is specified by slider and
numerical value box of 'FaceAlpha'. The contrast data becomes opaque
when 'FaceAlpha' is 1.0, and the structure and others are not seen
which hidden on the inside and the back side of the opaque Contrast
data. However, when 'FaceAlpha' is set as 0.0, the Contrast data
becomes clear and the structure and others appears.
5.2.2.
'Attribute Editor (Structure Edge)' panel
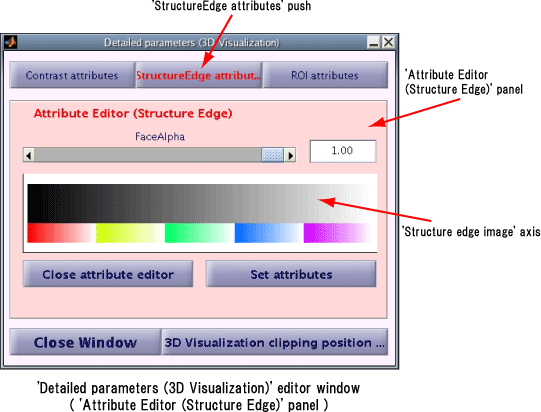
When 'StructureEdge attributes' button in 'Detailed
parameters (3D Visualization)' editor window is clicked, 'Attribute
Editor (Structure Edge)' panel is displayed. In 'Attribute
Editor(Structure Edge)' panel, the display attribute of edge of the
Structure image is set.
In MATLAB with upper version than R14 Service Pack 2(Version 7.0.4),
'Structure edge image' axis is displayed at the bottom in 'Attribute
Editor (Contrast)' panel. The Edge image of the Structure image is
displayed in 'Structure edge image' axis that is based on the display
attribute you set in the 'Attribute Editor (Structure Edge)' panel.
・ 'FaceAlpha'
The transparency of the edge of the Structure image is specified by
'FaceAlpha' slider and the numerical value box. When the 'FaceAlpha' is
set as 1.0, the edge of the Structure image becomes opaque. The inside
and the other side of the edge and the structure image are not seen.
When the 'FaceAlpha' is set to 0.0, the eage becomes transparent and
the structure in the inside and the other side of the edge of the
Structure image appear.
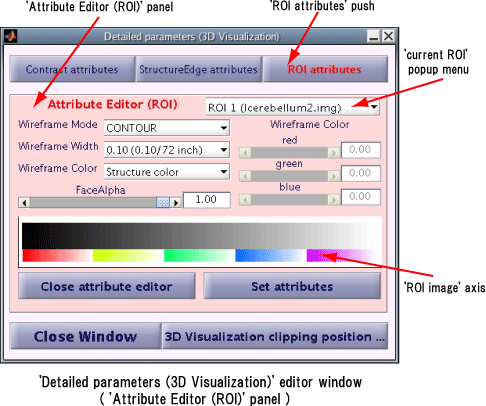
5.2.3. 'Attribute Editor
(ROI)' panel
When 'ROI attributes' button of 'Detailed
parameters (3D
Visualization)' editor window is clicked, 'Attribute Editor(ROI)'
panel is displayed. In 'Attribute Editor(ROI)' panel, the display
attribute of the ROI data is set. In MATLAB with upper version of R14
Service Pack 2(Version 7.0.4), 'ROI image' axis is displayed at the
bottom of the 'Attribute Editor(ROI)' panel. The ROI image data is
displayed in 'ROI image' axis that is based on the display attribute
you set in the 'Attribute Editor(ROI)' panel.
・ 'current ROI' popup menu
Select the ROI data that you would like to set the display attribute.
(Hereinafter, selected ROI data in the 'current ROI' popup menu is
called 'current ROI'. )
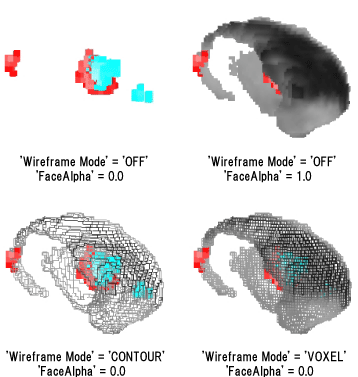
・ 'Wireframe Mode', 'Wireframe Width', 'Wireframe Color'
The wireframe display of the current ROI data is set with the
'Wireframe Mode' popup menu. The wireframe of the current ROI
data is not displayed for 'Off'. The outer of the current ROI data is
displayed the wireframe for 'CONTOUR'. When 'VOXEL' is selected, the
wireframe to all voxel of the current ROI data is displayed.
The thickness and the color of the wireframe are set with the
'Wireframe Width' popup menu and the 'Wireframe Color' popup menu. (the
'Wireframe Width' popup menu and the 'Wireframe Color' popup menu
cannot be set when the 'Off' is selected in the 'Wireframe Mode' popup
menu.) When 'Contrast color' is selected with the 'Wireframe Color'
popup menu, the wireframe is displayed by the color of the ROI data. If
'Manual color' is selected, the wireframe color is set with GUI at the
right of the 'Attribute Editor(ROI)' panel.
・ 'FaceAlpha'
The transparency of the current ROI data is specified by slider and the
numerical value box of 'FaceAlpha'. When the 'FaceAlpha' is set as 1.0,
the current ROI data becomes opaque. The inside and the other side of
the current ROI data are not seen. When the 'FaceAlpha' is set to 0.0,
the current ROI data becomes transparent and the structure in the
inside and the other side of the current ROI data appear.
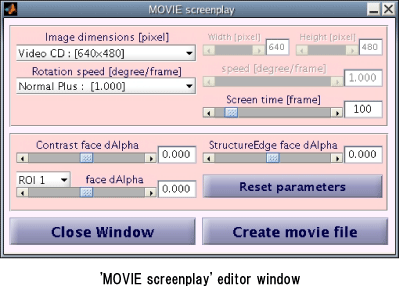
5.3. 'MOVIE
screenplay' editor window
'MOVIE screenplay' editor window appears when the 'MOVIE screenplay
editor' button on the '3D
Visualization' panel is clicked. Animation file (MPEG1 format) with
rotating three dimension display image is made with this 'MOVIE
screenplay' editor window.
・ 'Image dimensions'
The movie image size is set with the 'Image dimensions' popup menu.
When 'Manual mode' is selected, the image size is set by the
slider and the numerical value box at the right side of the 'Image
dimensions' popup menu.
・ 'Rotation speed', 'Screen time'
The movie file is made from the images which are the sight points
rotated around the target along the Z axis. Rotation speed of the sight
point is set with the 'Rotation speed' popup menu. When '-' value is
set on the 'Rotation speed' popup menu, the sight point rotates
clockwise along the Z axis. On the other hand, when the value is set as
'+', it rotates in counterclockwise. When 'Manual mode' is selected
with the 'Rotation speed' popup menu, the rotation speed is set by the
slider and the numerical value boxes at the right side of the 'Rotation
speed' popup menu. Moreover, the length of the movie frame is set with
'Screen time' popup menu.
・ 'face dAlha'
The displacement of the transparency of every one frame of the Contrast
data, the edge of Structure image, and the sectioned ROI data is set by
the 'Contrast face dAlpha', the 'StructureEdge face dAlpha', and the
'ROI face dAlpha'. The movie starts with the transparent value of the
'3D visualization' figure, then it changes each frame into the
transparent value you have set.
・ 'Create movie file' button
The 'Select
file' window appears, when you click the 'Create movie file' button
after setting the parameter to make the movie file. You can select the
movie file name here.
[Attention]
Making movie file is very
unstable. MATLAB hangs up in my environment immediately after the movie
file is generated. Moreover, this processing uses a large amount of
memory. Please note it on the computer with a small memory capacity.
・Gallery


